Origin Research is a FinTech company that allows its users to discover the analyzed financial data on high yield companies in order to figure out whether and when to buy/sell shares of those companies.
It offers detailed primers, insight pieces, two-pagers, user-editable detailed financial models, covenant summaries, company reports, prospectuses and transcripts, and peer comparison functionality for subscribed users.
Product: web application
The scope of our work: back-end, front-end, QA, design
Solutions: MVP
The client wanted to digitalize their offline investment consulting business by creating a digital platform.
The platform covers 2 types of users: users and admins.
Users comprise free-trial users and subscribers.
1) Free-trial users can:
2) Subscribed users can also:
Both free-trial users and subscribers can change their own info and reset their passwords.
Admins can be managers, analysts, support and salespeople.
Managers have the ability to:
Analysts can:
Salespeople can:
All admins can edit their own information. Only Managers and Analysts have abilities to add and update the content of any company, create/update and delete events.
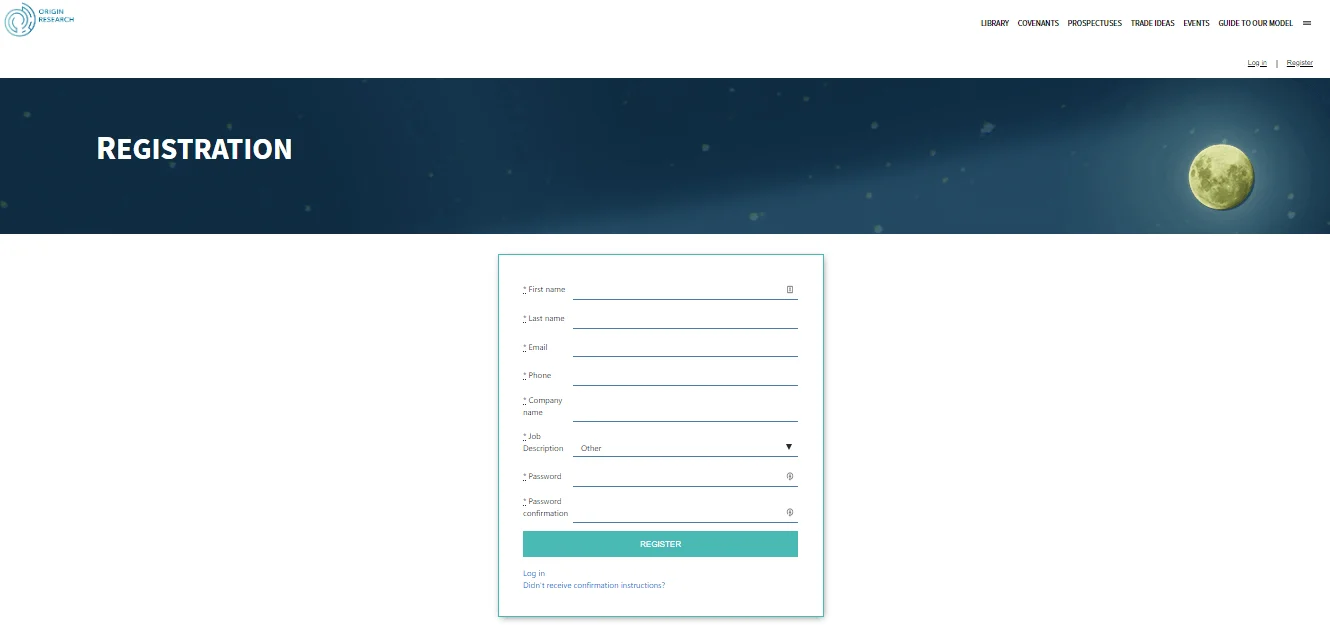
1) The users can register in the system using an email and password. After registration, users choose whether they want to start a free trial or to subscribe.
2) If a user becomes a subscriber then they can observe any company’s financial data. One month before a subscription ends, the platform’s system alerts a subscribed user to prolong the subscription.
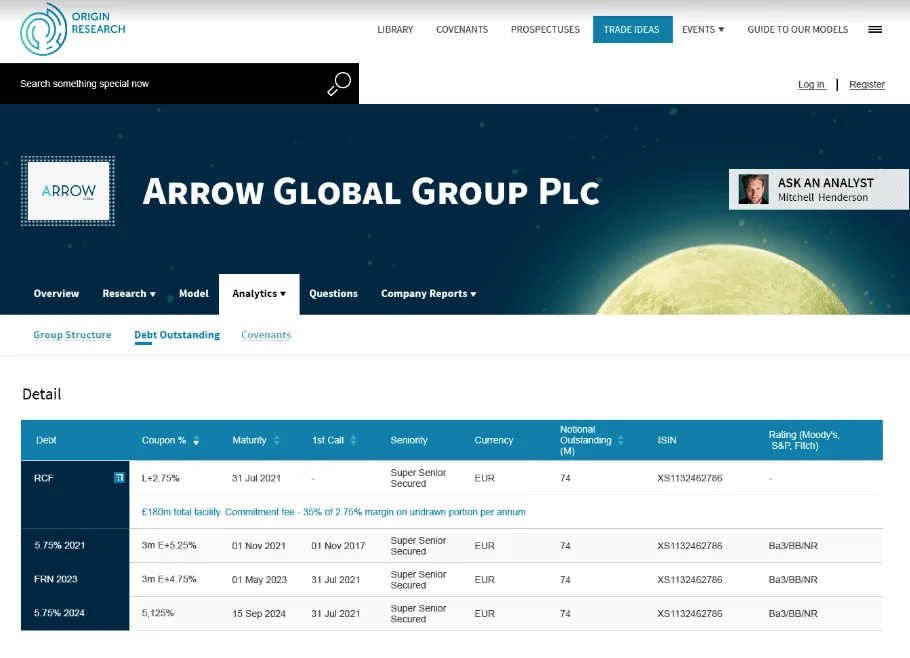
3) Subscribers are able to view the models. A model portfolio page provides an easy-to-find and complete overview of all the Origin Research recommendations in one place. Plus, the model page is a table which contains dynamic and static data. A part of the dynamic data is changeable so that users can conduct their custom calculations.
The spreadsheet shows the company’s benchmarks, like market value weight, the assumed capital requirement for a hedge fund and trade opening date.

4) Users can also compare different companies and their bonds. In fact, all the provided financial data can be compared by subscribed users.
Online calculation
We had to create an online Excel-like table with lots of numeric data and diverse variables that could be calculated for users in real-time.
Wijmo integration
Thanks to Wijmo, a tool that helps to visualise data with graphs and controls, we were able to create a model table and load the companies financial data there.
A model table is a table with financial data, like liquidation analysis, financial statements and base case models on high yield companies. In this table, you can edit certain data and see how other financial indicators will change with such modifications.
Also, there are many info tabs for each company. Plus, there are both changeable and fixed fields in the table.
Now, subscribers can make any necessary calculations online in the spreadsheet on the ‘Model’ page. The system will calculate the data automatically.
Moreover, subscribers are able to save the calculated data and share it with other Origin Research users. In addition, the shared calculations can be edited and saved by another user without losing the initial calculations. Therefore, a calculation model can be stored in several versions.
Sloboda Studio’s team has created the MVP of the Origin Research web application with clear server-side architecture and engaging UX for the client-side.
May 2017 - October 2017


Luca Labs Expenses is an app for the management of working expenses.

CityFALCON is a financial news aggregator that analyzes and collects financial tweets, news, and authors by using Natural Language Processing.
read more...