
Are you leveraging the right metrics to track your product’s success?
Understanding and utilizing key product management metrics can be the difference between leading the market or falling behind. This article explores the essential metrics that empower product managers, entrepreneurs, and development teams to make informed decisions, optimize performance, and deliver exceptional value to customers.
Importance of Product Management Metrics
Metrics are the backbone of informed decision-making in product management. They provide objective data that helps product managers understand user behavior, track performance, and make data-driven decisions that align with business goals.
Data-Driven Decision Making
Using metrics allows product managers to move away from gut feelings and anecdotal evidence. Data-driven decision-making ensures that strategies are based on solid evidence, leading to better outcomes and improved product performance.
Aligning Metrics with Business Goals
It’s crucial to select metrics that directly align with your business goals. Whether it’s increasing user engagement, boosting revenue, or improving customer satisfaction, the right metrics will help you measure progress and stay on track.
Talk to Experts About Your Product Goals

Key Types of Product Management Metrics
KPIs, Metrics, and OKRs: What’s the Difference?
Understanding the differences between Key Performance Indicators (KPIs), metrics, and Objectives and Key Results (OKRs) is fundamental for effective product management.
Metrics vs. KPIs: Metrics are specific measurements used to track performance, while KPIs are the most critical metrics that reflect the success of an organization in achieving its objectives.
KPIs vs. OKRs: KPIs measure the ongoing performance of specific activities, whereas OKRs set ambitious goals and track progress toward achieving them. OKRs are typically broader and more strategic than KPIs.
Examples of product OKRs include increasing user retention by 20% in the next quarter or reducing the average time to resolve customer issues by 50%.
| Metrics | KPIs | OKRs | |
|---|---|---|---|
| Definition | Specific measurements used to track performance | Critical metrics reflecting success in achieving objectives | Ambitious goals with key results tracking progress |
| Scope | Broad and numerous | Focused on key areas essential for business success | Broader and more strategic than KPIs |
| Purpose | Provide data on various aspects of product performance | Measure ongoing performance of specific activities | Set ambitious goals and track progress toward achieving them |
| Examples | Bounce Rate, Session Duration | Net Promoter Score (NPS), Customer Satisfaction Score (CSAT) | Increase user retention by 20% in the next quarter, Reduce issue resolution time by 50% |
Comparison of Metrics, KPIs, and OKRs
Revenue Metrics
We will begin by exploring financial metrics, often the primary focus for most organizations, before delving into other critical indicators of product success.
Lifetime Value (LTV) and Customer Lifetime Value (CLTV)
Lifetime Value estimates the total revenue a customer will generate during their lifetime with your product. It’s a key metric for understanding the long-term value of your customer relationships.
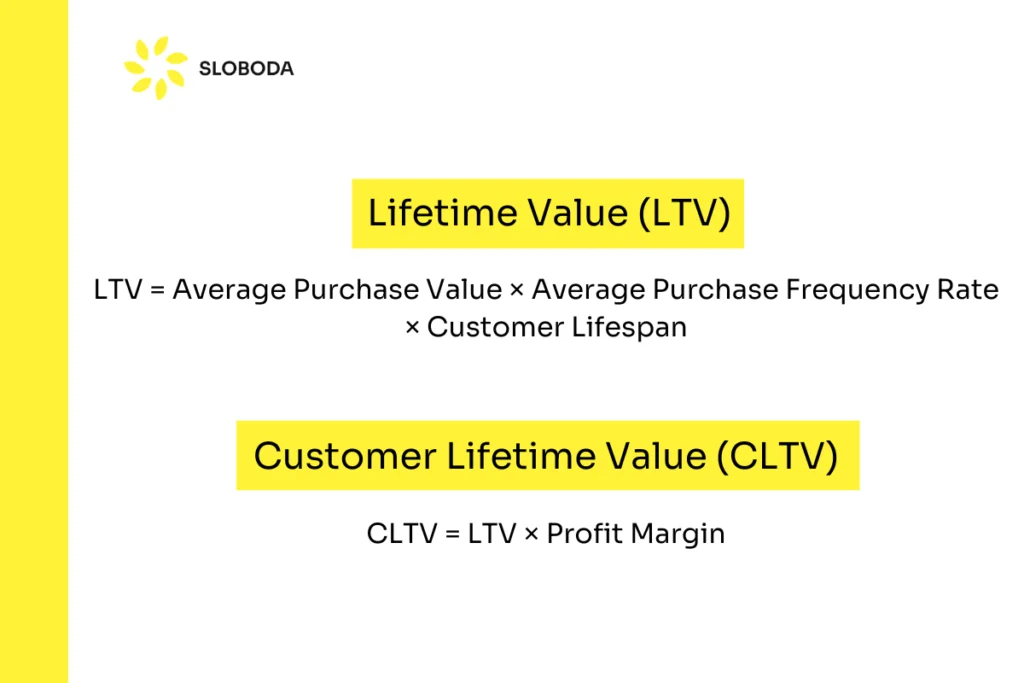
LTV = Average Purchase Value × Average Purchase Frequency Rate × Customer Lifespan
CLTV = LTV × Profit Margin
Monthly Recurring Revenue (MRR) and Annual Recurring Revenue (ARR)
MRR and ARR measure the predictable revenue generated from subscriptions on a monthly or annual basis. These metrics are essential for tracking the financial health of subscription-based products.
MRR = Total Monthly Revenue from Subscriptions
ARR = MRR × 12
Average Revenue Per User (ARPU)
Average Revenue Per User calculates the average revenue generated per user over a specific time period. It’s useful for understanding the revenue potential of your user base.
ARPU = Total Revenue / Number of Users
Acquisition Metrics
Cost Per Acquisition (CPA)
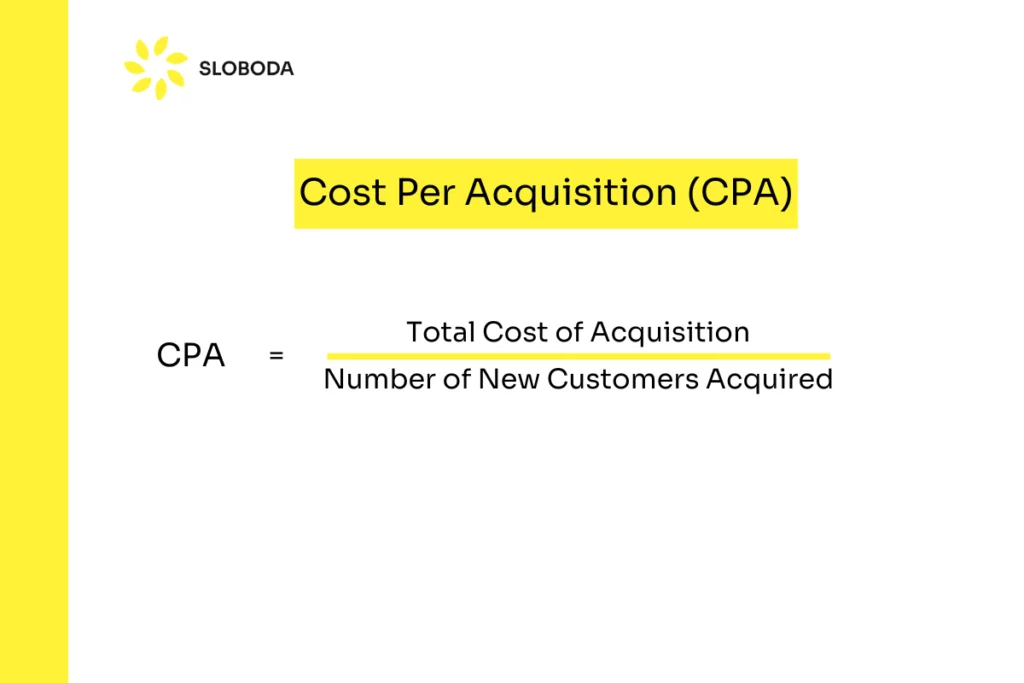
Cost Per Acquisition measures the cost associated with acquiring a new customer. It’s a crucial metric for understanding the efficiency of your marketing and sales efforts.
CPA = Total Cost of Acquisition / Number of New Customers Acquired
Customer Acquisition Cost (CAC)
Similar to CPA, Customer Acquisition Cost looks at the total cost of acquiring a customer, including marketing, sales, and any other related expenses.
CAC = Total Sales and Marketing Expenses / Number of New Customers Acquired
Bounce Rate
Bounce rate indicates the percentage of visitors who leave your product or website after viewing only one page. A high bounce rate can signal issues with user engagement or the relevance of your landing pages.
Bounce Rate = Non-engaged (Bounced) Sessions / Total Sessions × 100
Conversion Metrics
Conversion Rate (CVR)
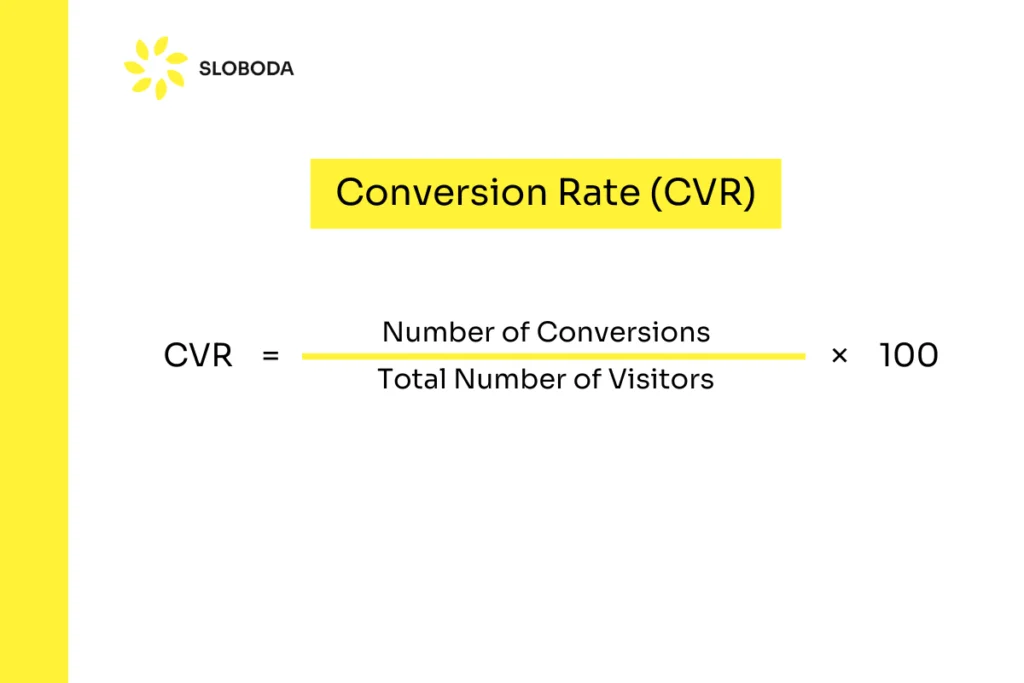
Conversion Rate measures the percentage of users who complete a desired action, such as signing up for a newsletter or making a purchase. It’s a key indicator of the effectiveness of your product’s user experience.
CVR = Number of Conversions / Total Number of Visitors × 100
Time to First Value (TTFV)
Time to First Value tracks the time it takes for a new user to achieve their first success or derive value from your product. A shorter TTFV can lead to higher user satisfaction and retention.
Conversion Funnel Drop-off Rate
This metric measures the percentage of users who drop off at each stage of the conversion funnel. Identifying and addressing high drop-off points can significantly improve overall conversion rates.
Conversion Funnel Drop-off Rate = Number of Users at Previous Stage − Number of Users at Current Stage / Number of Users at Previous Stage × 100
Engagement Metrics
Daily Active Users (DAU) and Monthly Active Users (MAU)
DAU and MAU are fundamental metrics for tracking user engagement. They measure the number of unique users who interact with your product daily or monthly, respectively.
DAU = Number of Unique Daily Users
MAU = Number of Unique Monthly Users
Session Duration
Session Duration tracks the average amount of time users spend on your product in a single session. Longer session durations often indicate higher user engagement.
Session Duration = Total Duration of All Sessions / Total Number of Sessions
Session Frequency
Session Frequency measures how often users return to your product within a specific time period. High session frequency suggests that users find your product valuable and engaging.
Feature Adoption Rate
This metric tracks the percentage of users who adopt and use specific features within your product. It helps you understand which features are most valuable to your users.
Feature Adoption Rate = Number of Users Using a Feature / Total Number of Users × 100

Optimize Your Product Strategy
Retention Metrics
Customer Retention Rate
Customer Retention Rate measures the percentage of customers who continue to use your product over a specified period. High retention rates indicate customer satisfaction and loyalty.
Retention Rate = Number of Customers at the End of the Period − Number of New Customers Acquired During the Period / Number of Customers at the Start of the Period × 100
Churn Rate
Churn Rate is the percentage of customers who stop using your product during a given time period. Reducing churn is critical for maintaining a stable user base and achieving long-term growth.
Churn Rate = Number of Customers Lost During the Period / Total Number of Customers at the Start of the Period × 100
Harward Business Review stated that “It’s not just marketers who look at churn, however. Many investors will use the metric to evaluate the underlying health of a firm. The higher the churn rate, the more they question the company’s viability.”
Net Promoter Score (NPS)
Net Promoter Score measures customer loyalty and satisfaction by asking users how likely they are to recommend your product to others. High NPS scores are indicative of strong customer relationships.
NPS = Percentage of Promoters − Percentage of Detractors
Customer Satisfaction Score (CSAT)
Customer Satisfaction Score gauges overall customer satisfaction with your product. It’s typically measured through surveys and provides direct feedback on user experience.
CSAT = Sum of All Customer Satisfaction Scores / Number of Respondents × 100
Customer Effort Score (CES)
Customer Effort Score measures how easy it is for customers to use your product or resolve issues. Lower effort scores are associated with higher customer satisfaction.
CES = Sum of All Effort Scores / Number of Respondents
| Metric | Definition | Formula |
|---|---|---|
| Lifetime Value (LTV) | Estimates the total revenue a customer will generate during their lifetime with your product | LTV = Average Purchase Value × Average Purchase Frequency Rate × Customer Lifespan |
| Customer Acquisition Cost (CAC) | Total cost associated with acquiring a new customer | CAC = Total Sales and Marketing Expenses / Number of New Customers Acquired |
| Churn Rate | Percentage of customers who stop using your product during a given time period | Churn Rate = (Number of Customers Lost During Period / Total Customers at Start of Period) × 100 |
| Net Promoter Score (NPS) | Measures customer loyalty and satisfaction | NPS = Percentage of Promoters − Percentage of Detractors |
| Average Revenue Per User (ARPU) | Average revenue generated per user over a specific time period | ARPU = Total Revenue / Number of Users |
| Conversion Rate (CVR) | Percentage of users who complete a desired action | CVR = (Number of Conversions / Total Number of Visitors) × 100 |
Key Product Management Metrics
Product Feedback and Optimization Metrics
Feature Request Tracking
Tracking feature requests helps you understand what users want and prioritize product development accordingly. It ensures that you are building features that align with user needs.
User Feedback Volume
The volume of user feedback can indicate overall user engagement and interest. High feedback volume suggests active users who are invested in improving the product.
Customer Sentiment Score
Customer Sentiment Score analyzes user feedback to gauge overall sentiment towards your product. Positive sentiment indicates user satisfaction, while negative sentiment highlights areas for improvement.
Escalation Rate
Escalation Rate measures the frequency at which user issues are escalated to higher levels of support. A high escalation rate can signal underlying product issues that need addressing.
Escalation Rate = Number of Escalated Issues / Total Number of Issues × 100
Advanced Metrics Frameworks
AARRR Framework (Pirate Metrics)
The AARRR framework focuses on five key metrics: Acquisition, Activation, Retention, Referral, and Revenue. It’s a comprehensive approach to tracking the entire user journey.
HEART Framework
The HEART framework evaluates user experience through Happiness, Engagement, Adoption, Retention, and Task success metrics. It’s particularly useful for understanding user satisfaction and engagement.
Best Practices for Choosing and Using Metrics
Identifying the Right Metrics for Your Product
Choosing the right metrics depends on your product’s goals, target audience, and stage in the product lifecycle. Focus on metrics that align with your specific objectives and provide actionable insights.
Aligning Metrics with Product Lifecycle Stages
Different metrics are relevant at different stages of the product lifecycle. For example, acquisition metrics are crucial during the launch phase, while retention metrics become more important as the product matures.
Communicating Metrics to Stakeholders
Effectively communicating metrics to stakeholders involves presenting data in a clear, concise, and actionable manner. Use visualizations and dashboards to make data more accessible and understandable.
Tools and Software for Tracking Metrics
Popular Tools for Product Management Metrics
Google Analytics dashboard
Tools like Google Analytics, Mixpanel, and Amplitude are popular for tracking various product management metrics. They offer robust features for data collection, analysis, and reporting.
Integrating Tools for Seamless Data Collection
Integrating different tools can streamline data collection and provide a more comprehensive view of your product’s performance. Look for tools that easily integrate with your existing systems.
Automation and Real-Time Reporting
Automation and real-time reporting tools help you stay on top of your metrics without manual intervention. They ensure that you have up-to-date information to make timely decisions.
Product Management Metrics Common Challenges and Pitfalls
Avoiding Metric Overload
Focusing on too many metrics can be overwhelming and counterproductive. Prioritize the most critical metrics that align with your goals and provide the most value.
Ensuring Data Accuracy
Accurate data is essential for reliable metrics. Implement rigorous data validation processes and regularly audit your data sources to maintain accuracy.
Keeping Metrics Aligned with Evolving Goals
As your product evolves, so should your metrics. Regularly review and update your metrics to ensure they remain relevant and aligned with your current objectives.
Future Trends in Product Management Metrics
Predictive Analytics
Predictive analytics uses historical data to forecast future trends. It’s becoming increasingly important for anticipating user behavior and making proactive decisions.
AI and Machine Learning in Metrics Tracking
AI and machine learning can enhance metrics tracking by providing deeper insights and automating complex analyses. These technologies are transforming how product managers approach metrics.
Emerging Metrics and Their Impact
New metrics are continually emerging as technology and user behavior evolve. Stay informed about these trends to ensure your metrics strategy remains cutting-edge.
Conclusion
Product management metrics are vital tools for understanding and improving your product’s performance. By selecting the right metrics, leveraging advanced frameworks, and using appropriate tools, you can make informed decisions that drive success. Stay adaptable and continuously refine your metrics strategy to meet evolving business needs.
Frequently Asked Questions
What Are the Most Important Product Management Metrics?
The most important metrics depend on your product and goals but generally include user engagement, retention, revenue, and customer satisfaction metrics.
How to Choose the Right Metrics for a Specific Product?
Choosing the right metrics involves understanding your product’s objectives, the needs of your target audience, and the stage of your product lifecycle. Focus on metrics that provide actionable insights and align with your business goals.
What Is the Difference Between KPIs, Metrics, and OKRs?
KPIs are specific, measurable indicators of performance. Metrics are broader measurements that track various aspects of your product. OKRs are goal-setting frameworks that combine qualitative objectives with quantitative key results.
How Often Should Product Managers Review Their Metrics?
Product managers should regularly review key metrics based on their nature:
- Daily: Real-time indicators like user activity or system performance.
- Weekly: Short-term trends such as engagement rates or feature usage.
- Monthly/Quarterly: Long-term performance metrics like revenue growth or customer retention.
Adjust the frequency according to the specific metrics and your product’s stage.
What Tools Are Best for Tracking Product Management Metrics?
Popular tools for tracking product management metrics include Google Analytics, Mixpanel, Amplitude, and Pendo. These tools offer robust features for data collection, analysis, and reporting.
How Can Metrics Improve Customer Satisfaction?
Metrics help identify areas where the product meets or falls short of customer expectations, allowing product managers to make data-driven improvements that enhance customer satisfaction.
What Are Some Common Mistakes to Avoid with Metrics?
Common mistakes include focusing on too many metrics, ignoring data accuracy, and failing to align metrics with business goals. It’s important to prioritize key metrics and ensure they are reliable and relevant.
How Do Predictive Analytics Impact Product Management Metrics?
Predictive analytics uses historical data to forecast future trends, helping product managers anticipate user behavior and make proactive decisions to improve product performance.
What Are the Benefits of Using the AARRR Framework?
The AARRR framework (Acquisition, Activation, Retention, Referral, Revenue) provides a comprehensive approach to tracking the entire user journey, helping product managers identify and address key areas for growth.
How Can AI and Machine Learning Enhance Metrics Tracking?
AI and machine learning can automate data collection and analysis, providing deeper insights and enabling more accurate and timely decision-making. These technologies are transforming metrics tracking in product management.
What Are Emerging Metrics and Their Impact?
Emerging metrics, such as those related to user engagement in new technologies like VR/AR, can provide insights into evolving user behaviors and preferences. Staying informed about these trends helps ensure your metrics strategy remains relevant.
By leveraging these insights and focusing on the right metrics, product managers can drive their products toward success, making informed decisions that align with their business goals and user needs.